Work / Pharmacy / Healthcare
From siloed tools to a single source of truth: a data platform and self-serve BI for a pharmacy group
We unified four disconnected systems into one data platform with self-serve BI — a single source of truth for a multi-location pharmacy group’s reporting.

Photo by Árpád Czapp on Unsplash
Unified.Four disconnected systems became one source of truth, with self-serve BI for every team.
The Challenge
A multi-location pharmacy group ran sales, marketing and operations on four disconnected systems: a CRM, a pharmacy management platform, a calling tool, and ad platforms like Meta. Critical reports arrived only as CSV files in shared inboxes. There was no single source of truth.
Every cross-functional question turned into a manual spreadsheet exercise: which providers had stopped ordering, whether ad spend was moving prescription volume, where operations were leaking time. Decisions waited on whoever could assemble the latest export. Each team worked from a partial, stale view of the same business. And as one member of a larger, growing healthcare group, the pharmacy could least afford to fly blind.
The Solution
Quarry built an end-to-end data platform that turned those scattered systems into one trustworthy foundation.
First, we built ingestion services that connect to each of those sources and continuously pull their records into a managed PostgreSQL warehouse — including the report files once trapped in email. Prescription history and patient-linked activity are protected health information under HIPAA, so governance wasn’t an afterthought: data that had circulated as CSV exports in shared inboxes moved into one warehouse with scoped, auditable access — the centralization itself closing the group’s loosest handling of PHI.
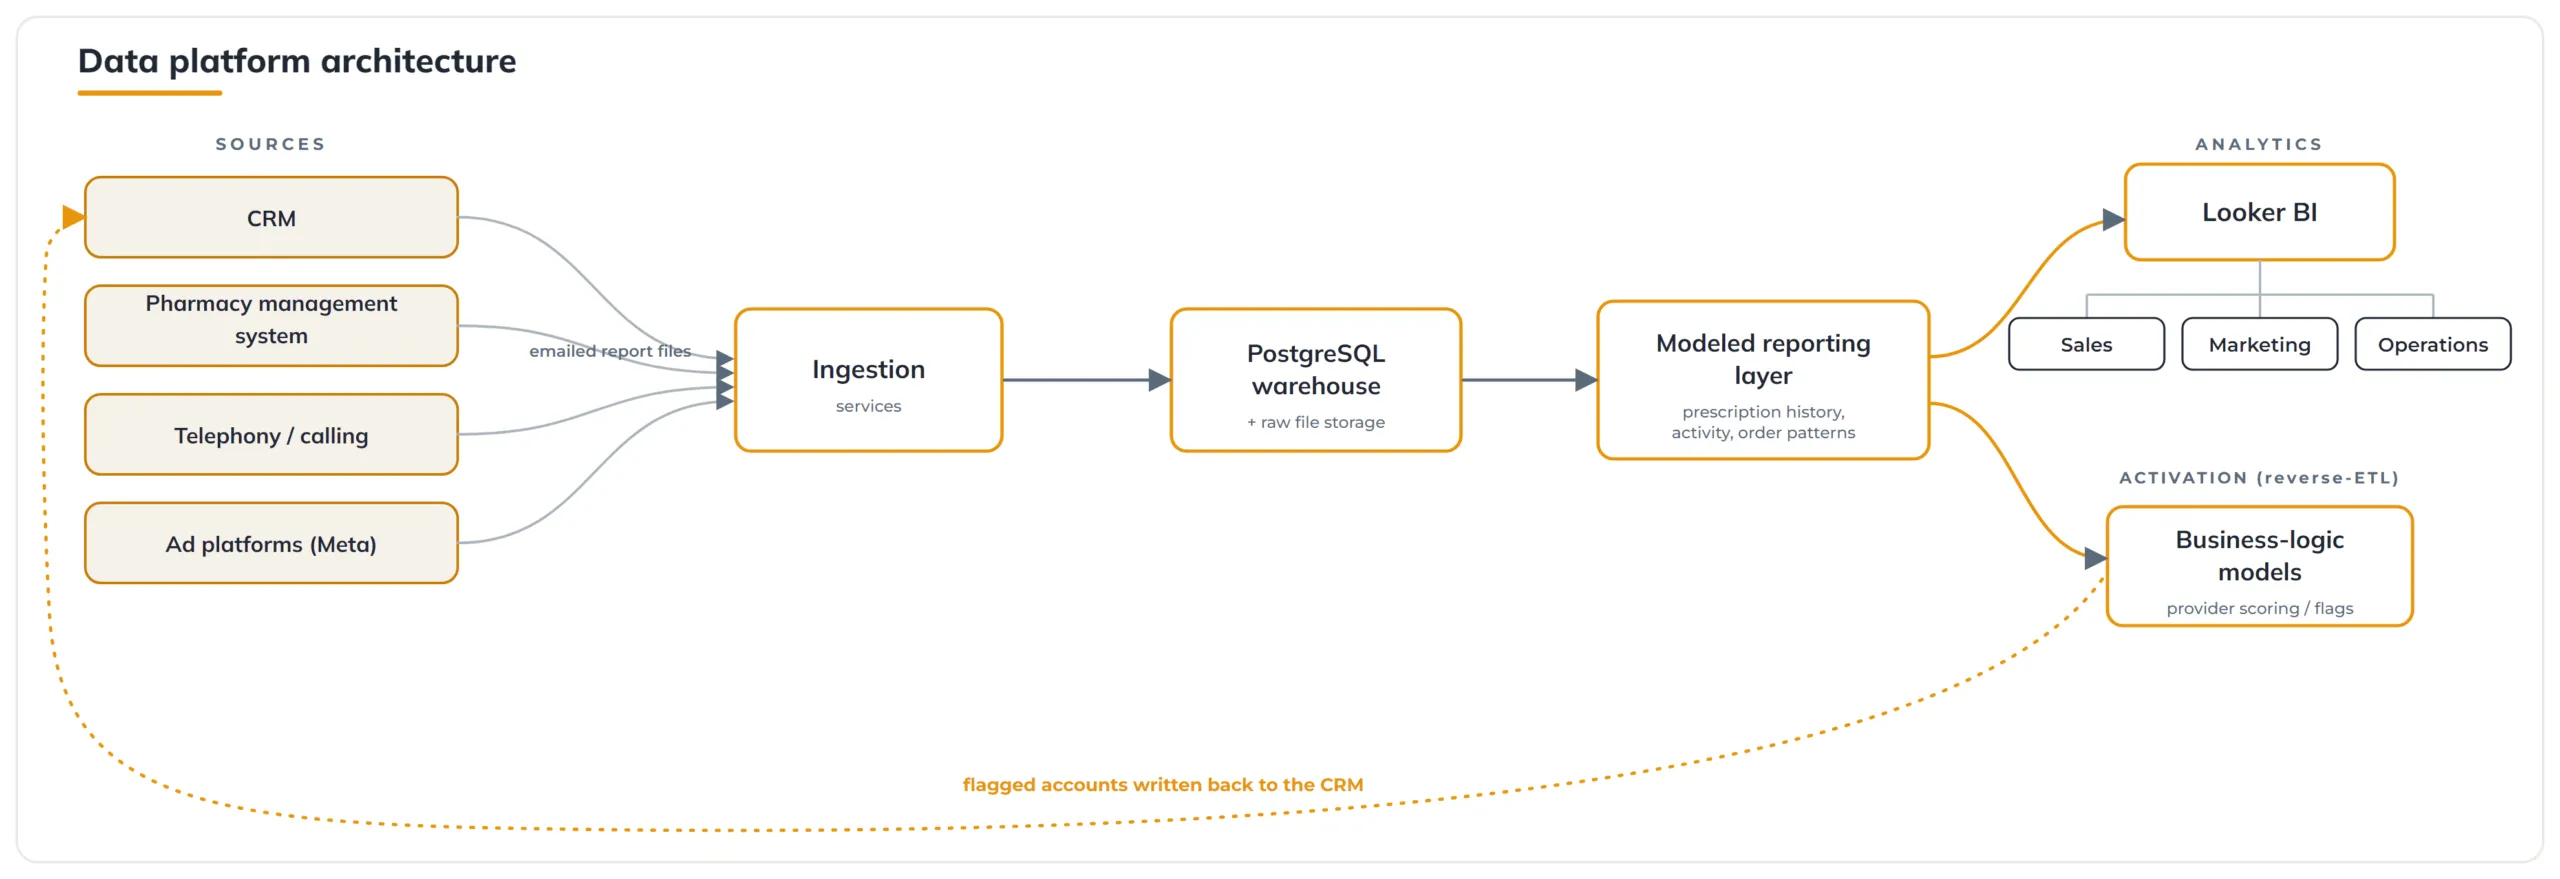
On top of it, we modeled a clean reporting layer: prescription history, customer activity, and order patterns refreshed daily, weekly and monthly. Patterns that were invisible in any single tool became something the business could see: who was slowing down, who was about to churn. Every team works from the same data instead of raw exports.
From there, we put the data to work in two directions. For analytics, a Looker layer gave sales, marketing and operations their own dashboards, each team answering its own questions from one governed source. For operations, we closed the loop: business-logic models we built flagged the accounts that mattered (gone quiet, never ordered, starting to slip) and wrote those signals back into the CRM. A rep now starts the day with that list, instead of a report nobody opened.
For the first time, every team is looking at the same numbers. Questions that used to take a day in spreadsheets now take a few clicks — and the system tells us which accounts to chase before we even ask.
— Operations Lead, multi-location pharmacy group
The Results
The group went from spreadsheet-bound guesswork to one source of truth every department trusts. Sales, marketing and operations each have self-serve Looker dashboards in place of manual export-and-stitch cycles.
More important, the data became operational. The platform doesn’t stop at describing the business; it queues the next call. And because the foundation was centralized rather than tied to any single tool, it scaled as the wider healthcare group grew around the pharmacy — without the reporting layer cracking.
Have a problem worth this kind of attention?
Start a projectMore work
 STRATEGYENGINEERINGDATA
10×revenue growth
Growing a travel membership from $2M to $20M ARR
 Harvest Hosts
 DESIGNSTRATEGY
$40kweek-one revenue lift
Optimizing a membership signup flow into a $40k week-one revenue lift
Harvest Hosts DESIGNENGINEERINGECOMMERCE
Replatformed.
Rebuilding a European travel-membership storefront on a headless Jamstack
Harvest Hosts